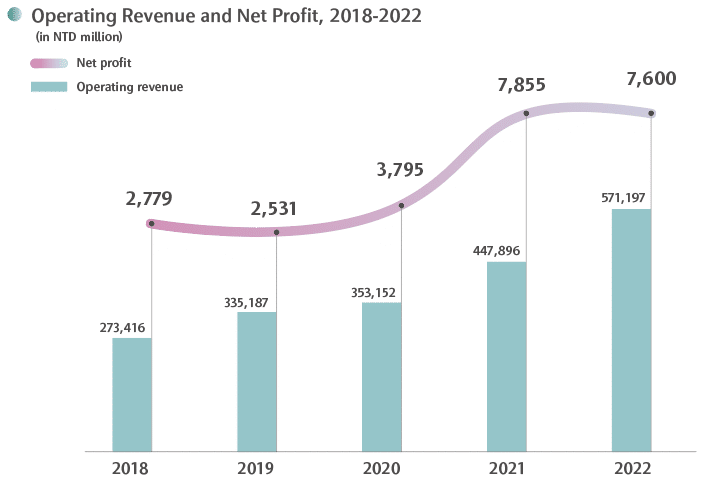
Continued growth in 2022! 28% increase in group operating revenue
WT’s operating revenue increased by 28% from NTD447.9 billion in 2021 to NTD571.2 billion in 2022. The net profit for 2022 was NTD7.6 billion, and the after-tax EPS was about NT$8.61 based on the weighted average number of shares.
Continuous optimization and upgrade in the semiconductor sector
Digital transformation has been accelerating since the pandemic began. With sustainable development, energy conservation, and carbon reduction as the shared goals, the semiconductor sector will maintain strong market potential in the long run. Despite the challenges from macroeconomic uncertainties and inventory adjustments in the semiconductor sector in the short term, WT will continue to develop high-growth products for applications such as third-generation semiconductors, electric vehicles, energy management, green energy, cloud data centers, 5G communications, etc, of which the rapid development also demands semiconductor components. In addition to further developing high-growth product application markets and increasing the market share, WT will carry on digital optimization to improve operational efficiency, optimize operational management systems, strengthen financial control systems, and strengthen human resource management to enhance our ability to provide added value in the semiconductor industry chain, and build the foundation for a sustainable corporate.
Operating Revenue and Profit, 2018-2022(in NTD million) |
2018 |
2019 |
2020 |
2021 |
2022 |
|---|---|---|---|---|---|
|
Operating revenue |
273,416 |
335,187 |
353,152 |
447,896 |
571,197 |
|
Operating costs |
262,771 |
324,387 |
342,378 |
430,909 |
551,365 |
|
Gross profit |
10,645 |
10,800 |
10,774 |
16,987 |
19,832 |
|
Operating expenses |
5,391 |
5,547 |
5,458 |
6,430 |
8,050 |
|
Selling expenses |
4,017 |
4,150 |
4,069 |
4,522 |
5,533 |
|
General and administrative expenses |
946 |
988 |
979 |
1,296 |
1,861 |
|
Research and development expenses |
368
|
407 |
386 |
609 |
655 |
|
Impairment loss determined in accordance with IFRS9 |
60 |
2 |
24 |
3 |
1 |
|
Operating profit |
5,254 |
5,253 |
5,316 |
10,557 |
11,782 |
|
Non-operating income and expenses |
-1,633 |
-1,944 |
-517 |
-377 |
-1,871 |
|
Profit before income tax |
3,621 |
3,309 |
4,799 |
10,180 |
9,911 |
|
Income tax expense |
842 |
778 |
1,004 |
2,325 |
2,311 |
|
Profit for the year |
2,779 |
2,531 |
3,795 |
7,855 |
7,600 |
|
Other comprehensive income (loss) |
261
|
-568 |
6,569 |
2,140 |
-7,070 |
|
Total comprehensive income for the year |
3,040 |
1,963 |
10,364 |
9,995 |
530 |
|
Basic earnings per share (in dollars ) |
5.02 |
4.32 |
5.22 |
9.96 |
8.61 |
Operating Revenue and Profit, 2018-2022(in NTD million)
2022 |
2021 |
2020 |
2019 |
2018 |
|
|---|---|---|---|---|---|
|
Operating revenue |
571,197 |
447,896 |
353,152 |
335,187 |
273,416 |
|
Operating costs |
551,365 |
430,909 |
342,378 |
324,387 |
262,771 |
|
Gross profit |
16,987 |
19,832 |
10,774 |
10,800 |
10,645 |
|
Operating expenses |
8,050 |
6,430 |
5,458 |
5,547 |
5,391 |
|
Selling expenses |
5,533 |
4,522 |
4,069 |
4,150 |
4,017 |
|
General and administrative expenses |
1,861 |
1,296 |
979 |
988 |
946 |
|
Research and development expenses |
655 |
609 |
386 |
407 |
368
|
|
Impairment loss determined in accordance with IFRS9 |
1 |
3 |
24 |
2 |
60 |
|
Operating profit |
11,782 |
10,557 |
5,316 |
5,253 |
5,254 |
|
Non-operating income and expenses |
-1,871 |
-377 |
-517 |
-1,944 |
-1,633 |
|
Profit before income tax |
9,911 |
10,180 |
4,799 |
3,309 |
3,621 |
|
Income tax expense |
2,325 |
2,311 |
1,004 |
778 |
842 |
|
Profit for the year |
7,600 |
7,855 |
3,795 |
2,531 |
2,779 |
|
Other comprehensive income (loss) |
-7,070 |
2,140 |
6,569 |
-568 |
261
|
|
Total comprehensive income for the year |
530 |
9,995 |
10,364 |
1,963 |
3,040 |
|
Basic earnings per share (in dollars ) |
8.61 |
9.96 |
5.22 |
4.32 |
5.02 |
GRI-specific Expenditure Disclosures(in NTD million) |
2018 |
2019 |
2020 |
2021 |
2022 |
|---|---|---|---|---|---|
|
Employee salary and benefits |
3,224 |
3,413 |
3,402 |
4,040 |
5,023 |
|
Interest expense and dividend |
3,080 |
3,341 |
2,636 |
3,305 |
7,147 |
|
Government subsidy |
0 |
0 |
0 |
0 |
0 |
|
Direct/Indirect political contributions |
0 |
0 |
0 |
0 |
0 |
|
Community investment spending |
7 |
7 |
8 |
15 |
11 |
|
Retained economic value (retained surplus) |
1,391 |
886 |
1,206 |
3,154 |
3,518 |
GRI-specific Expenditure Disclosures(in NTD million)
2022 |
2021 |
2020 |
2019 |
2018 |
|
|---|---|---|---|---|---|
|
Employee salary and benefits |
3,402 |
4,040 |
5,023 |
3,413 |
3,224 |
|
Interest expense and dividend |
7,147 |
3,305 |
2,636 |
3,341 |
3,080 |
|
Government subsidy |
0 |
0 |
0 |
0 |
0 |
|
Direct/Indirect political contributions |
0 |
0 |
0 |
0 |
0 |
|
Community investment spending |
11 |
15 |
8 |
7 |
7 |
|
Retained economic value (retained surplus) |
3,518 |
3,154 |
1,206 |
886 |
1,391 |